Sweatin' It!
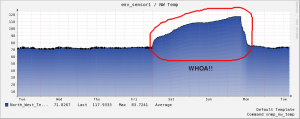
On a recommendation from @obfuscurity (http://obfuscurity.com/2012/07/Graph-Porn-and-Sharing), I want to share some data my team collected during a recent power outage following a strong windstorm in the Northeast. What I want to present isn't all that exciting: a simple graph showing the temperature in my data center. More, it's the result of this data collection and the resulting postmortem analysis that are interesting.
Several things happened during this event:
- We didn't get alerted when the temperature blew past our monitor's threshold. We nearly reached 120 degrees Fahrenheit!
- We couldn't access the data center to assess the situation physically due to the generator not powering the badge access system and door latches. We had to consider some rash actions (i.e. shutting down non-critical systems remotely) in lieu of seeing what was happening.
- After finally gaining physical access to the data center, we found an air handler was doing what is was supposed to. We just didn't want it to be doing it at the time!
During our postmortem review we identified what failed and why. We defined preventative measures to implement over the next few days including having extra master door keys made and having a ladder (yes!) handy.
As for the air handler performing correctly, and letting the servers cook, the problem lay in the fact that the condensation pump was not powered by the generator. The water level rose and the air handler shut off to prevent overflowing. The most important take away from this is that even facilities management needs postmortem analyses. I've had recent successes including the developers in postmortem reviews; it's time to include the facility manager in the process as well!
Tags