Nagios != Application Monitoring
Ask any sysadmin what he uses to monitor systems and services in his environment and chances are good the answer will be "Nagios". Ask him what he uses to monitor his applications and the answer may be quite different. You may get no answer at all. Nagios is meant to monitor servers, network devices, and services. Sure, it can be extended to monitor disk capacity, web page delivery speeds, and more, but Nagios, in general, is mostly one dimensional; it's not designed to monitor application states.In a small environment, Nagios is a fantastic tool that helps a sysadmin get a handle on what's up and what's not. At a small scale, it's also easier to explain that the "web server" is down or "DNS" isn't working and get your message across. However, when the organization grows, the distance between the systems and services a sysadmin manages and the users that consume the applications and services grows. With that distance comes a greater need to clearly communicate the impact of an outage on the availability of a given application.
I tried to find plugins for Nagios that would allow me to extend it for use in demonstrating application state such as Nagios BPI, but it didn't meet my needs. In fact, the BPI extension was too simplistic and rigid for my needs. I may detail my needs in a future post so that you, dear reader, can have something to measure my statements against.
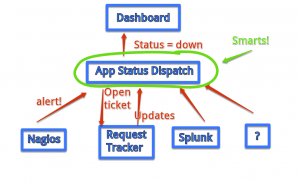
Suffice it to say that application monitoring must be done by you, the sysadmin, the developer, the janitor cum CIO at the new lean start-up. Only you know what your applications are and what their dependencies are. The trick is to recognize the various inputs you may have for all levels of monitoring such as Nagios, Splunk, Foglight, bash/Perl/Powershell scripts, etc. They all fulfill a given need and should all feed into a custom layer that you need to define and create to monitor application state. You need to build the "smarts" that glue all of the information and provide application state. To illustrate this, I've sketched a crude diagram:

You'll note the diagram includes references to Request Tracker and a dashboard. I need an application state monitor to also be intelligent enough to track state in a support ticket for historical purposes and reporting and provide updates to some outward-facing service where my customers can see that status of applications for themselves. Heck, with a few more smarts, that dashboard could probably link to Request Tracker for details. If that saves a call/email to my Support Desk, it's worth the effort. For my dashboard, I'm going to take Stashboard out for a drive.
NOTE: This is very similar to Google's Apps Status Dashboard. I'm shamelessly copying the idea and building my own system to do much the same thing.
Finally, I need my "smarts" to be useful from anything, anywhere. In other words, I need to build a system that can be accessed and updated from any source using a simple interface. I've decided to build a RESTful web application. All of my monitoring services can be extended (i.e. via custom scripts) so it should be simple enough to make HTTP requests to a RESTful web application. Since I'm strongest coding in Perl, after some research, I've settled on Dancer to quickly build my project. I'll serve up data via an SQLite backend and I expect to have the foundation for my application state monitor in place within a few hours.
I'll post more on this project as I progress.
Tags