NOTE: I wrote this on an internal company blog this week. It’s been modified for posting here.
For about the last year, I’ve had this little niggle pestering me: how to capture the value of a TCP socket’s listen backlog, specifically Apache’s, with the goal of helping to monitor pressure on the service in the form of unhandled connections. I’ve poked at this problem from time to time but had never found a solution, until now.
TCP Listen Backlog
For some background, know that whenever a process opens a TCP socket, it defines
a listen backlog value. This value determines the number of fully acknowledged
(SYN -> SYN/ACK -> ACK) connections that are waiting to be accept()ed by the
process. When requests are being processed quickly, this value should be 0, if
not really low.
Apache ListenBacklog
By default, Apache sets its listen backlog to 511 based on the
ListenBacklog
directive. However, the Linux kernel has a completely different idea in mind:
if the value of a socket’s listen backlog exceeds that of net.core.somaxconn
sysctl value (defaults to 128 on stock builds), the kernel quietly shrinks the
socket’s listen backlog to net.core.somaxconn. Thanks, Linus.
Tuning Apache and ss
While working on a project I needed to tune a small number of Apache boxes to handle a decent chunk of traffic (~3000 requests per second across 2, maybe 4 boxes). Our production web cluster contains a large number of servers so each box is configured to handle a small percentage of overall traffic. For this project, with fewer servers, I needed to tune Apache and possibly the kernel.
I set about tweaking Apache’s config and benchmarking performance. I launched
several sieges [1] against a few poor, unsuspecting Apache boxes and crushed
them. I knew about the TCP listen backlog and tuned net.core.somaxconn along
with Apache’s Server and Workers directives. I had hoped that ss [2] would
show me the state of the TCP listen backlog during these trials but I could
never surface the information.
Despite this, I was able to find a decent balance among the net.core.somaxconn
setting and Apache’s config so that requests were handled without connections
dropping. At a minimum, I was able to monitor the global ListenDrops and
ListenOverflow counters provided by netstat. And so it came to be that we
could serve lots of traffic on a small number of boxes.
Still, the TCP listen backlog taunted me, coming to me in my dreams. I may have even crafted what I imagined the backlog to look like out of mashed potatoes…
Trawling the Kernel and ss Source
I had enough. I started digging into kernel source this week to find the damned
thing. The more I dug, the more I found traces. First, I landed a direct hit in
include/net/sock.h with the following comment: [3]
* @sk_ack_backlog: current listen backlog
I’d caught the scent and it wafted, nay stang, with an impudence that dared me further. Heady with anticipation I trudged further into the kernel.
net/ipv4/tcp.c contains a function called tcp_get_info() that exposes TCP
information in a struct called tcp_info. When called, if a socket is in the
LISTEN state, it assigns the value of the listen backlog to a property called
tcpi_unacked: [4]
  if (sk->sk_state == TCP_LISTEN) {
    info->tcpi_unacked = sk->sk_ack_backlog;
Hoping that ss could finally be of some use again here (I never gave up on
this workhorse) I dug into its source (from iproute2-3.10) and found that it
does, in fact poll sockets for that same struct and will display the backlog:
  if (info->tcpi_unacked)
    printf(" unacked:%u", info->tcpi_unacked);
See, I never found this before because it made sense to me that any variables tracking a listen backlog would have the string ‘backlog’ somewhere in their names. Naming is especially hard when you give something a name that’s a bit overloaded.
Displaying Backlogged Connections with ss
Now that we know backlogged connections are defined as unacked, we can call
on ss to determine if the HTTP socket is backing up:
[root@apache01:~] $ ss -lti '( sport = :http )'
State      Recv-Q Send-Q   Local Address:Port    Peer Address:Port
LISTEN     223    511                  *:http               *:*
         rto:1000 mss:536 cwnd:10 unacked:223
The output above was output when siegeing Apache.
Finally, Mutha$%^&@n’ Graphs!
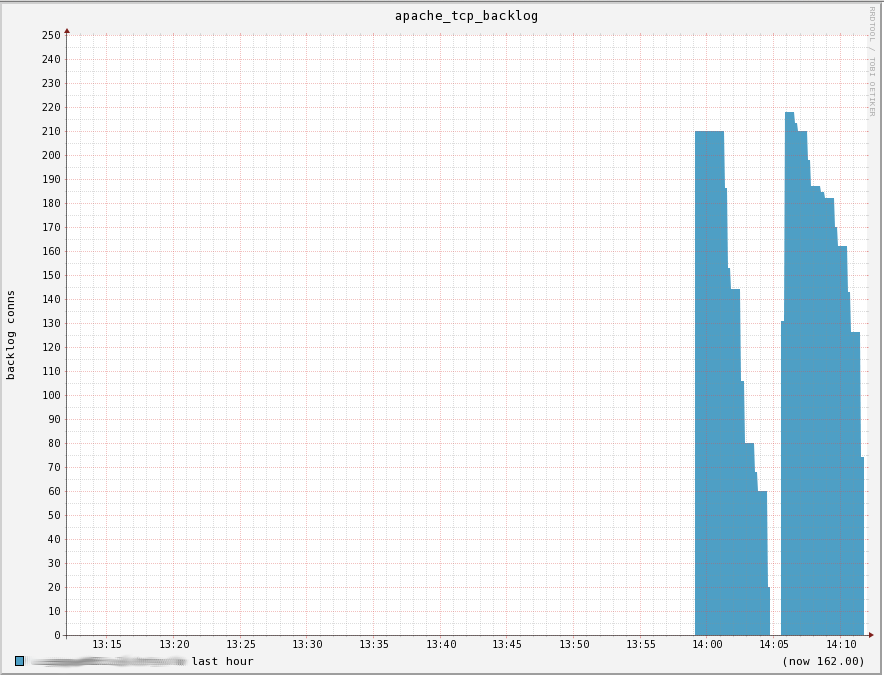
After a year, we’ve got TCP listen backlog graphs for Apache!

This graph was generated by reducing Apache’s available workers, variously
reducing net.core.somaxconn, and pummeling the box with siege. Look at
allllll those connections sitting, waiting to pulled off the backlog to be
processed by Apache. It’s GLORIOUS!
Typically, this graph should remain at 0 or very, very low. If it creeps up and is sustained, it demonstrates that Apache is unable process the volume of requests it’s receiving.
Gawd I love graphs!
References
[1] siege is a handy tool for assailing an HTTP server with requests. Check it out.
[2] ss is a handy tool that provides lots of information on sockets on system. Check it out.
[3] See https://git.kernel.org/cgit/linux/kernel/git/stable/linux-stable.git/tree/include/net/sock.h#n265
[4] See https://git.kernel.org/cgit/linux/kernel/git/stable/linux-stable.git/tree/net/ipv4/tcp.c#n2673
For a good introduction to how the TCP backlog works, give http://veithen.github.io/2014/01/01/how-tcp-backlog-works-in-linux.html a read.