I think a lot about alert design. I think about it even more when I’m on call and I’m square in the operator’s seat taking in information about exceeded thresholds, fielding reports from teammates about events they’re seeing, and trying to get some context around what’s happening. I want to fix the problem as soon as I can. Sometimes the alerts do little more than tell us that something went bump.
Often, after resolving an issue, I go back to an alert and try to dissect it, reasoning about what could make it more useful. Communication is difficult, especially in the absence of context. So, I look to outfit the alert with better information around the source of the alert. My hope is that the next engineer on call will find it helpful. At a minimum, I know the next time I’m on call and I receive that same alert, I’ll understand better what I need to do.
Good/Appropriate Context
But, what makes for good/appropriate context? The answer can be extremely relative, based on what the alert is for, how systems and services are run, and what’s important to the on-call engineers. When I’m looking to improve an alert, I often ask myself the following questions:
- How can this alert better define/illustrate what is broken?
- What threshold was met?
- What is the measured value versus the threshold?
- What assumptions were made when the check was written?
- Could exposing those assumptions aid in resolving the issue?
- What things can the operator look into, read, or test to better understand what’s happening?
- Can any of those things be automated or embedded in the alert?
Contextualizing Alerts
The first thing I think about when contextualizing an alert is which command I’d run, or which graph I’d look at, to gather more information. If the check that’s monitoring the failing resource can do anything extra for me, I add it. Next, I imagine how legible that output is a 3AM. How can I make really important bits stand out to the sleepy operator that barely has one eye open?
To that end, I’ve been working on a project that helps to format and embed information in alerts that operators may find helpful. Computers can, and should, do as much work as possible for us before they have to wake us up.
Context in Action
Let’s look at some example alerts before and after they’ve been contextualized.
CPU
Imagine a simple check that alerts an operator when the level of processor utilization is “too high”:
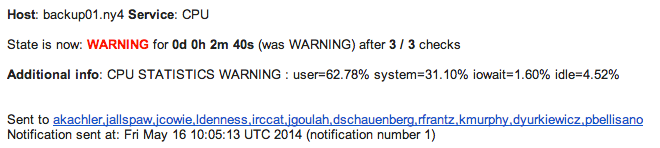
The only thing this alert can do is get my adrenaline pumping at an ungodly hour; I have no idea what’s happening
to this host until I get up, stumble to my laptop, login, and fire up top. After a few of these alerts, I got
wise and updated the check to tell me why the alert fired and include the top 5 processes by processor utilization:
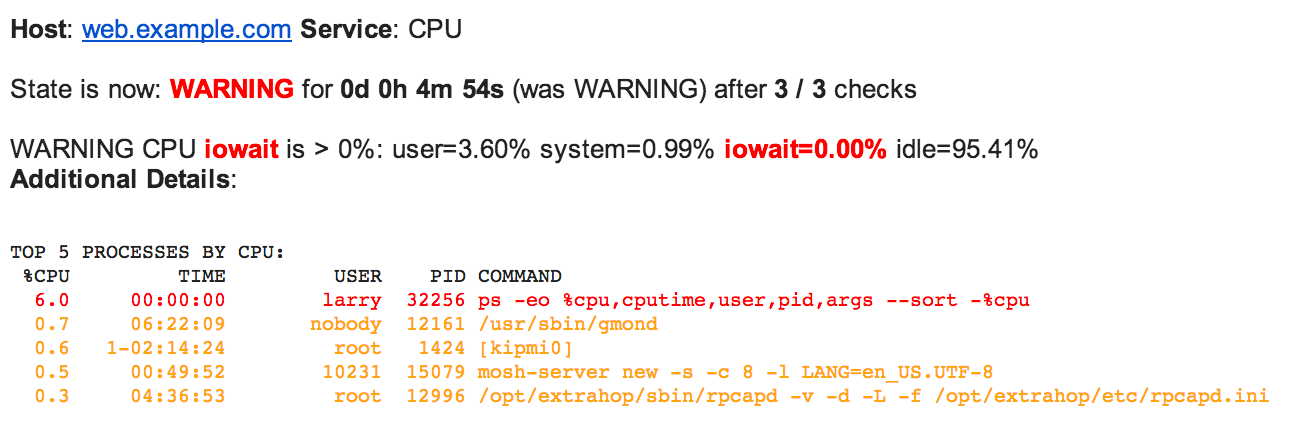
Now I can see that the IOWAIT is higher than expected, and my teammate larry is up to his usual late night
shenanigans. I’ve got more context with which to make a decision about what to do next before I’ve even gotten
out of bed. In this case, I might just acknowledge the alert and wait for larry to go to bed.
Disk Space
Among most operators, disk space alerts probably garner the most disdain for their lack of utility and frequency of delivery. It’s easy to understand why disk space alerts are perceived to be useless given the following example:
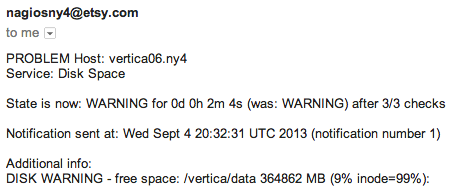
I’ve got a vague idea of which volume is problematic but I’d love to know more. For example, did disk space suddenly increase? Or did it grow gradually, only tipping the threshold as my head hit the pillow?
I’m probably going to run df out of habit, so let’s have the check do that. I can then use that output to do some
really nice things in my alert like so:
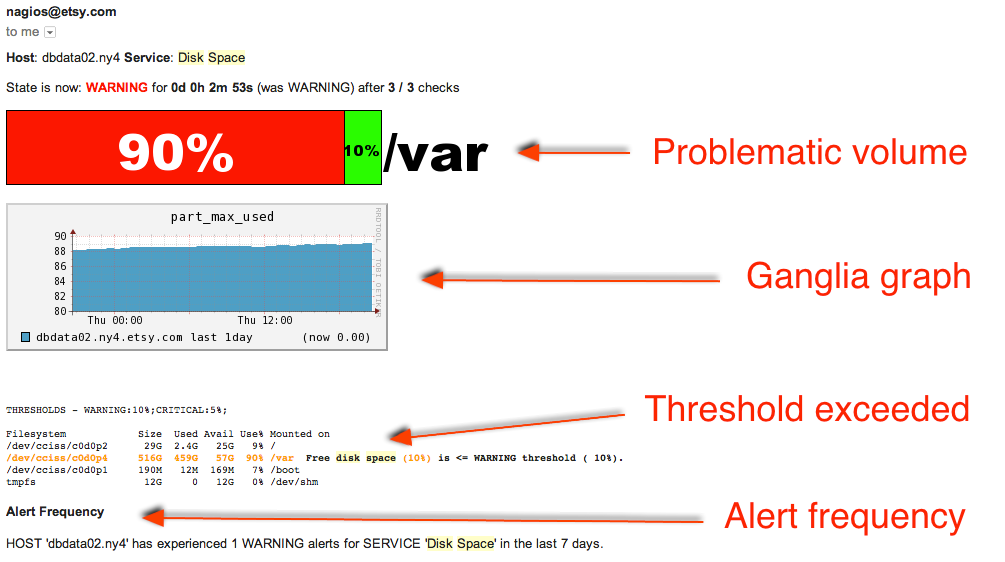
In the example above, the alert contains a stack bar to indicate which volume exceeded the threshold, a
Ganglia graph of disk utilization for the past 24 hours, highlighted df output illustrating which threshold
was exceeded, and information about how many times this particular alert has fired.
What’s Next?
For one, I’m always looking to improve the information in the alerts my team receives. I’ve also been working hard to finalize a project that makes it easier to format those alerts by highlighting text, embedding useful graphs, performing search queries, and more. Stay tuned for more information on that!
Tags